Peak salt: is the desalination dream over for the Gulf states?

The Middle East is home to 70% of the world’s desalination plants, but the more water they process, the less economically viable they become

By Stephen Leahy and Katherine Purvis (First published in the Guardian)

Gulf states are among the most water-scarce in the world. With few freshwater resources and low rainfall, many countries have turned to desalination (where salt is removed from seawater) for their clean water needs.

But Gulf states are heading for “peak salt”: the more they desalinate, the more concentrated wastewater, brine, is pumped back into the sea; and as the Gulf becomes saltier, desalination becomes more expensive.

“In time, it’s going to become impossible to use desalination in a way that makes economic sense,” says Gökçe Günel, an anthropologist at the University of Arizona. “The water will become so saline that it will be too expensive to desalinate.”

The Middle East is home to 70% of the world’s desalination plants – mostly in Saudi Arabia, the United Arab Emirates, Kuwait, and Bahrain. Tens of billions of dollars, $24.3bn (£18.8bn) in Saudi Arabia alone, are being invested over the next few years to expand desalination capacity.

The process is cost and energy intensive; it pumps seawater through special filters or boils it to remove the salts. The resulting brine can be nearly twice as salty as normal Gulf waters, according to John Burt, a biologist at New York University Abu Dhabi.

But the 250,000 sq km Gulf is more like a salt-water lake than a sea. It’s shallow, just 35 metres deep on average, and is almost entirely enclosed. The few rivers that feed the Gulf have been dammed or diverted and the region’s hot and dry climate results in high rates of evaporation. Add in a daily dose of around 70m cubic metres of super-salty wastewater from dozens of desalination plants, and it’s not surprising that the water in the Gulf is 25% saltier than normal seawater, says Burt, or that parts are becoming too salty to use.

Peak salt, says Günel, mirrors the concept of peak oil, a popular concept in the 1970s used to describe the point in time when the maximum rate of oil extraction had been reached. “Peak salt describes the point at which desalination becomes unfeasible,” she says.

And studies have shown that the Gulf will only get saltier in the future. Raed Bashitialshaaer, a water resources engineer at Sweden’s Lund University, says that the growth of desalination plants in the region is happening far faster than his own 2011 study estimated.

With groundwater sources either exhausted or non-existent and climate change bringing higher temperatures and less rainfall, Gulf states plan to nearly double the amount of desalination by 2030 (doc). This is bad news for marine life and for the cost of producing drinking water – unless something can be done about the brine.

Farid Benyahia, a chemical engineer at Qatar University, believes he has a solution. He recently patented a process that could eliminate the need for brine disposal by nearly 100%. The process uses pure carbon dioxide (emitted during the desalination process by burning fossil fuels for power) and ammonia to turn brine into baking soda and calcium chloride. Whether the process is cost-effective remains to be seen but Benyahia believes it could be, especially if markets are found for large volumes of the end products.

Other efforts are also under way to reduce desalination’s country-sized carbon footprint which globally accounts for 76m tonnes of carbon dioxide per year – nearly equivalent to Romania’s emissions in 2014.

The Global Clean Water Desalination Alliance was formed in 2015 to tackle this problem by increasing efficiencies and shifting to renewable energy sources, such as solar-powered desalination. Saudi Arabia expects to have a commercial-scale plant operational by 2017 and in California, a proposed solar-powered desalination plant combines innovation, efficiency and design.

Water pricing, says Günel, is also becoming critical to improving water efficiency in the Gulf.

“Climate change policymakers in the region are pushing for water pricing and awareness campaigns around consumption to explain to governments and citizens that they can’t continue to use water in the same way.”

‘We Have Nothing Without Water’ – Treehugger Interviews Author of Your Water Footprint

Screen Shot 2014-11-23 at 11.06.18 AM

Why care about your water footprint?

"Your water footprint" by Stephen Leahy

© “Your water footprint” by Stephen Leahy. Groundwater comes from aquifers that take thousands of years to fill. Globally, aquifers are being drained faster than then can refill.

Margaret Badore (@mbadore) Science / Clean Water

November 18, 2014

We learn in elementary school that water is in a constant cycle of evaporation and precipitation, making our crops grow and flowing from rivers into oceans. While the amount of water on Earth remains fairly stable, its distribution around the globe is changing, and this change is being accelerated by human activities.

A new book, “Your Water Footprint,” by environmental reporter Stephen Leahy, takes a close look at the “virtual water” that surrounds us in everyday life. This isn’t just the water we use to boil pasta or take a shower, it’s the water that’s used to grow our coffee beans and power the local energy plant. As the demand for this kind of water increases, the more threatened our access to fresh water becomes. At the same time, pollution makes vast amounts of water unusable.

I had the opportunity to catch up with Leahy over Skype.

TreeHugger: What were your goals for writing this book?

Stephen Leahy: To help people understand this other aspect of water that we use, that we don’t see. This virtual water concept: the water it takes to make things, the water it takes to grow our food, to make our products, to make our clothing. This is that unseen water that we don’t think about, and because we don’t see it, we’re not really aware of it.

It’s an enormous amount of water that we end up consuming every day without realizing it.

TreeHugger: The book is very number heavy, which makes it easy to compare how much water is used in different things. How did you go about finding all the data?

Leahy: It was a nightmare actually, the numbers. Especially for a person who’s a writer, not a numbers guy.

What I did, and this was based on covering science for many years, was figure out a baseline. Who is the best researcher? Who has the best data collection of water footprints? It turned out to be the University of Twente in the Netherlands, and they actually pioneered the concept of water footprints. They’ve developed a whole methodology about how you calculate it, and they’ve done piles of studies of the various water footprints of various products. Sometimes not in the way we think of products. So, they would do a water footprint for wheat, but that doesn’t necessarily translate into a burger bun or bread, so I did that. I figured out how much wheat goes into a loaf of bread and did that part of the calculation myself.

So, University of Twente was a godsend, because there are lots of different ways of calculating water footprints, and there’s different numbers out there.

TreeHugger: In the introduction, you discuss this concept of the “water-food-energy nexus.” I’m hoping to can tell us a little more about that.

Leahy: Most people realize that we need water for food, but what most people don’t understand is that we also need water for energy. There’s no form of energy that doesn’t need water. We have a growing population, and a growing shift in diets from vegetable-based to meat-based, which uses a lot more water. At the same time, there’s a billion people who don’t have access to electricity and they of course want to get electricity. As we look to produce more energy and more food, we’re going to need more water. This is the point of the nexus: we don’t have enough water to do all that in the future.

TreeHugger: So, looking forward, we need to reduce our water footprint. I think a lot of our readers are going to be familiar with the concept of reducing a carbon footprint, and in a lot of ways these concepts overlap. So, from your perspective, what are the ways the two footprints don’t overlap?

Leahy: Certainly on the energy side they overlap a lot. But on the food side, that’s probably the best example. If you switch from a meat-based diet to a vegetarian diet, you could reduce your daily water footprint by 1,300 liters. So, that’s an enormous amount of water when you put it over a year, nearly half a million liters in savings.

The other thing you can do is swapping beef for chicken. Swapping beef for chicken for a family of four would save 900 liters of water.

Food waste is another example, 38 to 40 percent of food in North America is wasted, and that’s a huge amount of water embedded in that food. The “best before” dates are actually problematic in that regard, because it doesn’t really mean the food is bad, it just means the company’s not guaranteeing the flavor.

TreeHugger: I also wanted to ask you about how you think about the trade-offs between the water impact of a product and some of the other impacts of a product. I was thinking about tee-shirts, because I write about clothes a lot. So, on one hand, we could say cotton is natural, it can be low in toxins if we use natural dyes and it’s biodegradable. On the other hand, cotton has a high water footprint. Then if we look at polyester, it has a lower water footprint, but there are concerns about it releasing toxins as it breaks down and contributing to micro plastic pollution. So, how do you look at these kinds of trade-offs? Do you have advice for weighing them?

Leahy: This gets a little bit complicated, because a big number for a water footprint is not necessarily indicative of something that’s bad. If you’re in a water-rich area and need a lot of water, and you’re not polluting this water, that’s going to be okay.

It’s kind of site-specific and product-specific, so this does make it quite a bit more complicated. On the clothing side of things, if you’re growing cotton in a country that has reasonable amounts of rainfall and preferably it’s grown organically, that is it’s grown without pesticides and chemicals, you’re greatly reducing the contamination of water. And if you’re using rain-fed cotton and not depleting an underground source, those are some conditions under which we could talk about products being truly sustainable, because you could continue this for quite a while.

TreeHugger: So, as we look to the future, there are many areas that will soon be facing the collapse of “water bubbles.” Do you think we need to see a shift in water policies or do we need to reduce our personal water consumption? Or is it both?

Leahy: It’s both. From a government policy point of view, water needs to be respected a lot more in terms of managing it long-term. There are places like California that don’t have any rules about how much ground water you can take. Anyone can take as much groundwater as they like—and that’s not uncommon.

The other side of course is consumers. I think consumers need to raise the issue more with both their elected leaders but also the industry. Some industries have responded, Levi’s has greatly reduced their water use for the production side, although it’s not exactly waterless since it takes a lot of water to grow cotton. So, that’s a role for consumers: asking, ‘Where is this product made? Where did it come from?’

Because there are certain things that don’t make any sense. For instance, Egypt is the number two exporter of oranges in the world. Egypt, well it’s is basically a desert, so why are they exporting all these oranges? There are actually all these economic reasons that don’t make any sense from a sustainability point of view. So consumers can make a decision and say, I’m not going to buy a product that requires a lot of water from the desert, because that’s just dumb.

The point about the virtual water is that we have very little without water. So, we’re extraordinarily dependent on water in ways we just don’t realize. And yet, we under-price water, water is very cheap, and water doesn’t get the respect it deserves.

This interview has been shortened and condensed.

Original post

Your Water Footprint:  The Shocking Facts About How Much Water We Use To Make Everyday Products

October 2014 Firefly Books, 160 Pages, 125 Unique Infographics only $19.95 Paperback (Also avail in hardcover) Order today

In US:  AmazonPowell’s Books; Barnes&NobleIndiebound

Canada:  Chapters-Indigo Signed copies avail at Blue Heron Books – Stephen’s home town bookstore

UK:  WH SmithAmazonWaterstones

Australia: Angus & RobertsonBooktopia

New Zealand: Mighty Ape

High Seas Represent $148 Billion Carbon Sink But Overfishing is Destroying It

Tuna from the Spanish Purse Seiner

By STEPHEN LEAHY

Stephen Leahy's picture


Scientists estimate that phytoplankton absorb and bury more than 1.6 billion tonnes of CO2 in the seabed every year.

This would be news to readers of Canada’s Globe and Mail newspaper’s detailed two-page spread on the Global Ocean Commission report, which failed to mention this vitally important carbon reduction service (or that it is worth an estimated $148 billion a year).

Additionally, if governments ended fishing in the unclaimed oceans beyond 200-mile economic zones, near-shore fish catches would soar, even more carbon would be safely removed from the atmosphere and the oceans would be healthier said co-author of the study Rashid Sumaila of the University of British Columbia’s Fisheries Centre.

The high seas are like a failed state. Poor governance and the absence of policing and management mean valuable resources are unprotected or being squandered,” said David Miliband, co-chair of the commission and former foreign secretary of the United Kingdom.

The dollar value of all the fish caught in high seas is actually negative

Governments like Japan, Spain, the U.S. and China subsidize fishing fleets to destroy the high seas by overfishing and deep-sea bottom trawling to the tune of $152 million a year.

Here’s the kicker: The dollar value of all the fish caught way out there is actually negative when costs like fuel and subsidies are subtracted. Turns out high seas fishing fleets get 25 per cent of their income from subsidies according to a 2009 analysis by Sumaila.

Most would not be fishing the high seas without subsidies” Sumaila told DeSmog Canada.

Restoring ocean productivity

Fishing should be banned in the high seas, which represent 64 per cent of the world’s oceans just to protect and enhance its role as a carbon sponge, he said. But that is just one of 14 other valuable services the high seas provide humanity according their study, The High Seas And Us: Understanding The Value Of High Seas Ecosystems.

The study was commissioned by the Global Ocean Commission, an 18-month-old organization comprised of business leaders and former senior politicians including former Canadian prime minister Paul Martin.

The commission is calling for the negotiation of a new agreement under the UN Convention on the Law of the Sea to prioritize ocean health and resilience and restore ocean productivity. It also called for an elimination of subsidies on high seas fishing within five years.

The commission’s proposals also call for mandatory tracking of all vessels fishing in the high seas, a ban on the transshipment of fish at sea, measures to end plastics pollution and binding standards for the regulation and control of offshore oil and gas exploration and exploitation.

Carbon really does sink

Phytoplankton are the carbon-eating plants of the seas and pass on this carbon when they’re eaten. When organisms die in the deep seas, their organic matter ends up on the bottom of the ocean, which makes for an effective, natural carbon sequestration process.

Fishing is crippling this free carbon-removal system. This is especially true for bottom-trawlers that bulldoze the sea floor scooping up every living thing. Trawling is by far the most common fishing method and recent studies warn it’s destroying corals and the sea bottom leading to “long-term biological desertification.”

Last May, scientists writing in the journal Science called for an end to “the frontier mentality of exploitation” of the high seas and recommended a ban on trawling to protect the carbon-removal service and halt the decline in the productivity of the oceans. The amount of wild fish caught peaked 20 years ago.

About 70 per cent of fish caught inside the 200-mile limits spend some time in the high seas. If the high seas are protected those fish are likely to grow larger and become more numerous, benefitting near-shore fisheries, Sumaila said.

A number of studies of marine protected zones where fishing is banned or very limited show these areas act as baby-fish incubators increasing the overall population of fish.

If fishing was banned in the high seas, fisheries profits would more than double, the amount of fish would increase 30 per cent and the amount of ocean fish stock conservation would increase 150 per cent according to a study published in PLOS Biology last March.

Given the reality that fishing the high seas is a money loser, even a low carbon price could make a fishing ban valuable, not to mention the other potential benefits of regulating international fisheries. Sumaila said the $148 billion-a-year value of the high seas carbon sponge is a conservative estimate, and it could actually be as high as $222 billion.

Fishing and trawling bans have been proposed before. Last December the European parliament narrowly rejected a bottom-trawling ban on its vessels.

We need wide public understanding of the vital importance of the high seas to all of us,” concluded Sumaila.

Top 10 High Seas Fishing Nations (according to Sumaila’s study) in descending order:
Japan
South Korea
Taiwan
Spain
USA
Chile
China
Indonesia
Philippines
France

First published by DeSmog Canada Wed, 2014-06-25 10:01

Free Public Talk on How You Consume 2000 Gallons of Water Every Day

Stephen Leahy sml

 [I will be in the L.A. area Feb 9 to 16 and available for interviews and book signings – Contact me

Critically Acclaimed New Book Investigating The Enormous Amounts Of  ‘Hidden’ Water We Consume Every Day

It takes more than 7,600 liters (2,000 gallons) of water to make a single pair of jeans. That morning cup of coffee required 140 liters (37 gallons) of water before it found its way to your table—water that was used to grow, process and ship the coffee beans. When we spend money on food, clothes, cellphones or even electricity, we are buying water  — a shockingly large amount of water.

WATER IS MORE VALUABLE AND USEFUL THAN OIL

Your Water Footprint: The Shocking Facts About How Much Water We Use To Make Everyday Products reveals how water is essential to our way of life in ways we never imagined. While water usage continues to soar, shortages now affect more than 3 billion people including millions of Americans and Canadians. A decade from now 3 out of 5 people will face water shortages.

Your Water Footprint provides essential information to reduce your water use which will help you save money, be prepared for shortages and ensure our children and grandchildren will have abundant fresh water.  Water-wise choices is all about smart substitutions and changes, rather than sacrifice and self-denial.


“…a brilliant and shocking exposé on precisely how much water we use…” – Publishers Weekly

…exceptionally lucid narration with arresting, full-page info graphics”  — Booklist

Your Water Footprint:  The Shocking Facts About How Much Water We Use To Make Everyday Products

October 2014 Firefly Books, 160 Pages, 125 Unique Infographics only $19.95 Paperback (Also avail in hardcover) Order today

In US:  AmazonPowell’s Books; Barnes&NobleIndiebound

Canada:  Chapters-Indigo Signed copies avail at Blue Heron Books – Stephen’s home town bookstore; In Ottawa visit the legendary Octopus Books

UK:  WH SmithAmazonWaterstones

Australia: Angus & RobertsonBooktopia

New Zealand: Mighty Ape

Water is far more valuable and useful than oil

Average water footprint of bottle of cola

The water footprint of a half-litre bottle of water is 5.5 litres – yet well over a billion people live in areas with chronic scarcity

By Stephen Leahy

I have a confession: I knocked back 320 pints at the pub last night. I actually only had two shots of a decent single malt but it took 320 pints of water to grow and process the grain used to make the whisky. That’s a whole lot of water considering the average bathtub holds 60 to 80 litres.

Even after 20 years of covering environmental issues in two dozen countries I had no idea of the incredible amounts of water needed to grow food or make things. Now, after two years working on my book Your Water Footprint: the shocking facts about how much water we use to make everyday products, I’m still amazed that the t-shirt I’m wearing needed 3,000 litres to grow and process the cotton; or that 140 litres went into my morning cup of coffee. The rest of my breakfast swallowed 1,012 litres: small orange juice (200 litres); two slices of toast (112 litres); two strips of bacon (300 litres); and two eggs (400 litres).

Water more valuable and useful than oil

Researching all this I soon realised that we’re surrounded by a hidden world of water. Litres and litres of it are consumed by everything we eat, and everything we use and buy. Cars, furniture, books, dishes, TVs, highways, buildings, jewellery, toys and even electricity would not exist without water. It’s no exaggeration to say that water is far more valuable and useful than oil.

front cover resized1A water footprint adds up the amount of water consumed to make, grow or produce something. I use the term consumed to make it clear that this is water that can no longer be used for anything else. Often water can be cleaned or reused so those amounts of water are not included in the water footprints in the book. The water footprint of 500ml of bottled water is 5.5 litres: 0.5 for the water in the bottle and another five contaminated in the process of making the plastic bottle from oil. The five litres consumed in making the bottle are as real water as the 500ml you might drink but hardly anyone in business or government accounts for it.

The incredible amounts of water documented in Your Water Footprint are based primarily on research done at the University of Twente in the Netherlands, where Arjen Hoekstra originated the concept of water footprints. The amount consumed to make something varies enormously depending on where the raw materials come from and how they are processed. Wheat grown in dry desert air of Morocco needs a lot more water than wheat grown in soggy Britain. For simplicity, the amounts in the book are global averages.

One of the biggest surprises was learning how small direct use of water for drinking, cooking and showering is by comparison. Each day the average North American uses 300 to 400 litres. (Flushing toilets is the biggest water daily use, not showers.) 400 litres is not a trivial amount; however, the virtual water that’s in the things we eat, wear and use each day averages 7,500 litres in North America, resulting in a daily water footprint of almost 8,000 litres. That’s more than twice the size of the global average. Think of running shoes side by side: the global shoe is a size 8; the North American a size 18. By contrast, the average water footprint of an individual living in China or India is size 6.

Peak water is here

Water scarcity is a reality in much of the world. About 1.2 billion people live in areas with chronic scarcity, while 2 billion are affected by shortages every year. And as the ongoing drought in California proves, water scarcity is an increasing reality for the US and Canada. Water experts estimate that by 2025 three in five people may be living with water shortages.

While low-flow shower heads and toilets are great water savers, the water footprint concept can lead to even bigger reductions in water consumption. For example green fuels may not be so green from a water consumption perspective. Biodiesel made from soybeans has an enormous water footprint, averaging more than 11,000 litres per litre of biodiesel. And this doesn’t include the large amounts of water needed for processing. Why so much water? Green plants aren’t “energy-dense,” so it takes a lot of soy to make the fuel.

Beef also has a big footprint, over 11,000 litres for a kilo. If a family of four served chicken instead of beef they’d reduce their water use by an astonishing 900,000 litres a year. That’s enough to fill an Olympic size pool to a depth of two feet. If this same family of opted for Meatless Mondays, they’d save another 400,000 litres. Now they could fill that pool halfway.

We can do nearly everything using less water. It’s all about smart substitutions and changes, rather than sacrifice and self-denial, but we can’t make the right choices unless we begin to see and understand the invisible ways in which we rely on water.

First published at The Guardian

Treehugger Interview with Your Water Footprint Author Stephen Leahy

Screen Shot 2014-11-23 at 11.06.18 AM

Why care about your water footprint?


"Your water footprint" by Stephen Leahy

© “Your water footprint” by Stephen Leahy. Groundwater comes from aquifers that take thousands of years to fill. Globally, aquifers are being drained faster than then can refill.

Margaret Badore (@mbadore) Science / Clean Water

November 18, 2014

We learn in elementary school that water is in a constant cycle of evaporation and precipitation, making our crops grow and flowing from rivers into oceans. While the amount of water on Earth remains fairly stable, its distribution around the globe is changing, and this change is being accelerated by human activities.

A new book, “Your Water Footprint,” by environmental reporter Stephen Leahy, takes a close look at the “virtual water” that surrounds us in everyday life. This isn’t just the water we use to boil pasta or take a shower, it’s the water that’s used to grow our coffee beans and power the local energy plant. As the demand for this kind of water increases, the more threatened our access to fresh water becomes. At the same time, pollution makes vast amounts of water unusable.

I had the opportunity to catch up with Leahy over Skype.

TreeHugger: What were your goals for writing this book?

Stephen Leahy: To help people understand this other aspect of water that we use, that we don’t see. This virtual water concept: the water it takes to make things, the water it takes to grow our food, to make our products, to make our clothing. This is that unseen water that we don’t think about, and because we don’t see it, we’re not really aware of it.

It’s an enormous amount of water that we end up consuming every day without realizing it.

Continue reading

Canada Leading ‘Deforestation Nation’ In Race to Destroy Planet’s Last Wilderness Areas

Canada's tar sands projects visible from space
Canada’s tar sands projects visible from space

Forest Loss Results in Massive Emissions of CO2

UXBRIDGE, Canada, Sep 5 2014 (IPS) 

The world’s last remaining forest wilderness is rapidly being lost – and much of this is taking place in Canada, not in Brazil or Indonesia where deforestation has so far made the headlines.

A new satellite study reveals that since 2000 more than 104 million hectares of forests – an area three times the size of Germany – have been destroyed or degraded.

Since 2000 more than 104 million hectares of forests – an area three times the size of Germany – have been destroyed or degraded.


“Every four seconds, an area of the size of a football (soccer) field is lost,” said Christoph Thies of Greenpeace International.

The extent of this forest loss, which is clearly visible in satellite images taken in 2000 and 2013, is “absolutely appalling” and has a global impact, Thies told IPS, because forests play a crucial in regulating the climate.


The current level of deforestation is putting more CO2 into the atmosphere than all the world’s cars, trucks, ships and planes together, he said, adding that “governments must take urgent action” to protect intact forests by creating more protected areas, strengthening the rights of forest communities and other measures, including convincing lumber, furniture manufacturers and others to refuse to use products from virgin forests.

Greenpeace is one of several partners in the Intact Forest Landscapes initiative, along with the University of Maryland, World Resources Institute and WWF-Russia among others, that uses satellite imagery technology to determine the location and extent of the world’s last large undisturbed forests.

The new study found that half of forest loss from deforestation and degradation occurred in just three countries: Canada, Russia and Brazil. These countries are also home to about 65 percent of world’s remaining forest wilderness.

However, despite all the media attention on deforestation in the Amazon forest and the forests of Indonesia, it is Canada that has been leading the world in forest loss since 2000, accounting for 21 percent of global forest loss. By contrast, the much-better known deforestation in Indonesia has accounted for only four percent.

Brazil's Amazon forest - 2013. Credit_Courtesy of Global Forest Watch

Massive increases in oil sands and shale gas developments, as well as logging and road building, are the major cause of Canada’s forest loss, said Peter Lee of Global Forest Watch Canada, an independent Canadian NGO.

A big increase in forest fires is another cause of forest loss. Climate change has rapidly warmed northern Canada, drying out the boreal forests and bogs and making them more vulnerable to fires.

In Canada’s northern Alberta’s oil sands region, more than 12.5 million hectares of forest have been crisscrossed by roads, pipelines, power transmission lines and other infrastructure, Lee told IPS.

Canada’s oil sands and shale gas developments are expected to double and possibly triple in the next decade and “there’s little interest at the federal or provincial political level in conserving intact forest landscapes,” Lee added.

The world’s last remaining large undisturbed forests are where most of the planet’s remaining wild animals, birds, plants and other species live, Nigel Sizer, Global Director of the Forest Programme at the World Resources Institute, told a press conference.

Animals like Siberian tigers, orangutans and woodland caribou require large areas of forest wilderness, Sizer noted, and “losing these top species leads to a decline of entire forest ecosystems in subtle ways that are hard to measure.”

While forests can re-grow, this takes many decades, and in northern forests more than 100 years. However, if species go extinct or there are too few individuals left, it will take longer for a full forest ecosystem to recover – if ever.

In just 13 years, South America’s Paraguay converted an incredible 78 percent of its remaining forest wilderness mainly into large-scale soybean farms and rough pasture, the study found. Satellite images and maps on the new Global Forest Watch website offer see-it-with-your-own eyes images of Paraguay’s forests vanishing over time.

The images and data collected for the study are accessible via various tools on the website. They reveal that 25 percent of Europe’s largest remaining forest, located 900 km north of Moscow, has been chopped down to feed industrial logging operations. In the Congo, home of the world’s second largest tropical forest, 17 percent has been lost to logging, mining and road building. The Global Forest Watch website also shows details of huge areas of Congo forest licensed for future logging.

Deforestation starts with road building, often linked to logging and extractive industries, said Thies. In some countries, like Brazil and Paraguay, the prime reason is conversion to large-scale agriculture, usually for crops that will be exported.

The new data could help companies with sustainability commitments in determining which areas to avoid when sourcing commodities like timber, palm oil, beef and soy. Market-led efforts need to gain further support given the lax governance and enforcement in many of these forest regions, Thies said.

He called on the Forest Stewardship Council (FSC) – a voluntary certification programme that sets standards for forest management – to “also play a stronger role” and to improve those standards in order to better protect wilderness forests.

Without urgent action to curb deforestation, it is doubtful that any large-scale wild forest will remain by the end of this century, concluded Sizer.

First published on IPS

Website for my new book: Your Water Footprint

YWF website logoNew Book Investigating The Enormous Amounts Of  ‘Hidden’ Water We Consume Every Day

By Journalist Stephen Leahy, Winner of the 2012 Prince Albert/United Nations Global Prize for Reporting on Climate Change

It takes more than 7,600 liters (2,000 gallons) of water to make a single pair of jeans. That morning cup of coffee required 140 liters (37 gallons) of water before it found its way to your table—water that was used to grow, process and ship the coffee beans. When we spend money on food, clothes, cellphones or even electricity, we are buying water  — a shockingly large amount of water.

New Website featuring:

Articles: How to save 900,000 litres of water at the dinner table

Sample Infographics

About the Author (including video)

Reviews

Your Water Footprint by Stephen Leahy

http://yourwaterfootprint.me

WATER IS MORE VALUABLE AND USEFUL THAN OIL

The Shocking Facts About How Much Water We Use to Make Everyday Products

Screen Shot 2014-07-20 at 10.28.00 AMYour Water Footprint 

By journalist Stephen Leahy, winner of the 2012 United Nations Global Prize for Climate Change and Environment Coverage

“…a brilliant and shocking exposé on precisely how much water we use…” – Publishers Weekly

Do you know you’re wearing water? It takes more than 7,600 liters (2,000 gallons) of water to make a single pair of jeans and another 2,460 liters (650 gallons) to make a T-shirt. And you’re eating water too. That morning cup of coffee required 140 liters (37 gallons) of water before it found its way to your table—water that was used to grow, process and ship the coffee beans. If you include toast, two eggs and some milk in your coffee, the water footprint of your breakfast totals about 700 liters (185 gallons).

Furniture, houses, cars, roads, buildings— practically everything we make uses water in the manufacturing process. When we spend money on food, clothes, cellphones or even electricity, we are buying water. A lot of water. Generating electricity from coal, oil, gas, and nuclear or hydro power involves the world’s second biggest use of water after food production.YWF graphic -YWF shirt

…exceptionally lucid narration with arresting, full-page info graphics”  — Booklist,  starred review

Your Water Footprint:  The Shocking Facts About How Much Water We Use To Make Everyday Products

Published by Firefly Books:  160 Pages, 125 Unique Infographics, $19.95 Paperback (Also avail in hardcover)

Order on Amazon.com

In Canada:  Order on Chapters-Indigo

In UK:  Order on WH Smith

More reviews and sample graphics on Your Water Footprint Website

We Have Five Years to Stop Building Coal Plants and Gas-Powered Cars

Measurement of CO2 levels in atmosphere

By Stephen Leahy

[Authors note: One of the most difficult and important articles I’ve written in 20 years of environmental journalism. Originally published Sept 6 2014 @Vice Motherboard]


Here’s the frightening implication of a landmark study on CO2 emissions:

By 2018, no new cars, homes, schools, factories, or electrical power plants should be built anywhere in the world, ever again, unless they’re either replacements for old ones or carbon neutral. Otherwise greenhouse gas emissions will push global warming past 2˚C of temperature rise worldwide, threatening the survival of many people currently living on the planet.

Every climate expert will tell you we’re on a tight carbon budget as it is—that only so many tons of carbon dioxide (CO2) can be pumped into the atmosphere before the global climate will overheat. We’ve already warmed temperatures 0.85˚C from pre-industrial levels, and the number rises every year. While no one thinks 2˚ C is safeper se, it’s safer than going even higher and running the risk that global warming will spiral out of our control completely.

Last year, the latest Intergovernmental Panel on Climate Change (IPCC) report established a global carbon budget for the first time. It essentially stated that starting in 2014, the carbon we can afford is up to around 1,000 billion tons of CO2. In other words, our cars, factories, and power plants can only emit 1,000 billion tons (1,000 Gt, or gigatons) of CO2 into the atmosphere if we want to have a greater than 50/50 chance of keeping our climate below 2˚C of warming.

Even considering that humanity pumped 36 gigatons of CO2 into the atmosphere last year alone, 1,000 Gt still seems like a big budget. It might even seem like we have room to spare.

Maybe not.

WORLDWIDE, WE’VE BUILT MORE COAL-BURNING POWER PLANTS IN THE PAST DECADE THAN IN ANY PREVIOUS DECADE

New research shows that we may not have been paying attention to the entire CO2 emissions picture. We’ve only been counting annual emissions, and not the fact that building a new coal or gas power plant is in reality a commitment to pumping out CO2 for the lifespan of a given plant—which usually ranges from 40 to 60 years. These future emissions are known as a carbon commitment.

A new study has tallied the carbon commitments from all existing coal and gas power plants by looking at their annual CO2 emissions and current age. The study assumes an operating life of 40 years. A 38-year old coal plant will have far smaller future CO2 emissions, and thus smaller carbon commitment than one built today. The study, “Commitment accounting of CO2 emissions,” determined that most new power plants that went online in 2012 have a very large carbon commitment—19 Gt of CO2.

Building new power plants means more carbon commitments to eat into our 2˚C carbon budget. Build enough giant coal plants today, and their future emissions would tie up the entire budget, leaving no room for any other source of CO2 emissions.

Meanwhile, the rate at which new plants are built far outpaces the closure of old plants. Many US coal plants operate for longer than 40 years; the oldest is currently around 70 years.

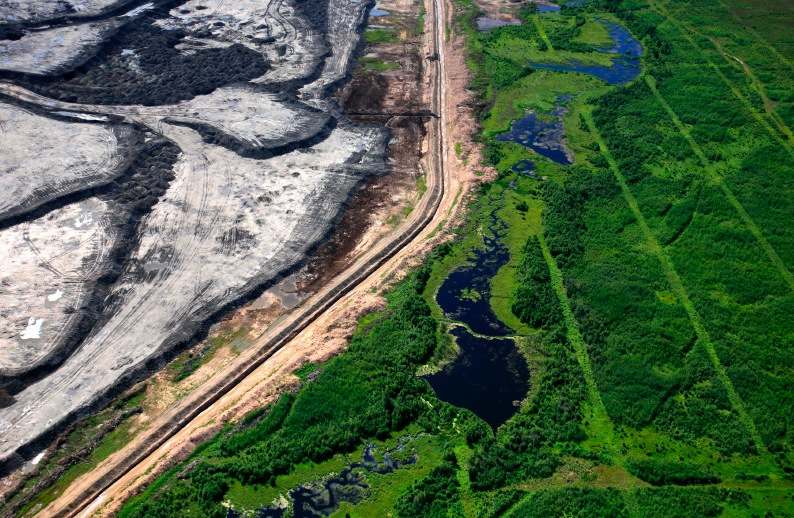
“Worldwide, we’ve built more coal-burning power plants in the past decade than in any previous decade, and closures of old plants aren’t keeping pace with this expansion,” said study co-author Steven Davis of the University of California, Irvine.

Image: Flickr

Fossil Fuels Power Plant Carbon Commitment: 300 Gt

In the study, Davis and co-author Robert Socolow of Princeton University calculated that the existing coal and gas power plant carbon commitment turns out to be very large—more than 300 Gt.

Non-Power Plant Carbon Commitment: 400 Gt 

The reality of carbon commitment applies to any new fossil-fuel burning infrastructure, including office buildings and homes using gas heating or automobiles and planes burning jet fuel. All of these have an operating life of several or many years during which they will emit CO2 from now until they are ‘retired.’ These future emissions also count as a carbon commitment. In another upcoming study, Davis calculated the carbon commitments from other CO2 sources, including from the transport, industry, commercial and residential sectors. He estimates that as of 2013 this carbon commitment exceeded 400 Gt.

Together with the power plant commitment of 300 Gt laid out in the current study, that’s more than 700 Gt in carbon commitments on a global carbon budget of 1000 Gt. That leaves less than 300 Gt for future power plants, steel mills, cement plants, buildings, and other stuff that burns fossil fuels.

At current rates we’ll have accounted for the remainder of the budget in only five years.

Here’s how it breaks down:

Estimated Annual Emissions 2014-2018: 200 Gt

Global CO2 emissions from all sources amounted to 36 Gt in 2013. Annual emissions have been growing at a rate of 2 to 3 percent per year. Without major efforts to reduce emissions, another 200 gigatons of CO2 will be emitted between 2014 and 2018.

Estimated New Carbon Commitments 2014-2018: 100 Gt

Davis and Socolow determined that carbon commitments from new fossil fuel burning infrastructure will average at least 20 Gt per year, totaling 100 Gt over five years.

300 + 400 +200 +100 = 1,000 Gigatons of Carbon, Locked in by 2018

Unless coal and gas power plants or other major sources of CO2 are shut down before the end of their life span, the 1,000 Gt global carbon budget will be fully allocated sometime in 2018. No one will notice, because things won’t look or feel too much different than today. CO2 is akin to a slow, trans-generational poison. The climate impacts of blowing the carbon budget won’t be felt until 2030 or 2040 —and for a long time after.

WE’VE BEEN HIDING WHAT’S GOING ON FROM OURSELVES: A HIGH-CARBON FUTURE IS BEING LOCKED IN BY THE WORLD’S CAPITAL INVESTMENTS

Even the climate experts won’t notice much, because annual CO2 emissions have been the sole focus of countries and the United Nations process to address climate change said Davis.

“That’s like driving down the highway and only looking out of the side window,” Davis told me.

Politicians, business leaders, investors, planners, bureaucrats and whole lot of other people should be looking out the front window and paying attention to the hard reality of carbon commitments. If Davis and Socolow’s calculations are correct, it means no new coal or gas power plants can go online after 2018 unless they’re replacing retired plants. It means freezing the size of the global automobile fleet, and the industrial and commercial sectors, unless their energy efficiency increases. And so on.

The fact that much of our current and future infrastructure carries huge carbon commitments is blindingly obvious, but receives little attention.

Can’t solve a problem by making it worse

“If you build it, there will be emissions year after year. This should be a fundamental part of the decision to build most things,”” Davis said.

Ignoring the reality of carbon commitments means we’re investing heavily in technologies that make the problem worse, he said.

“We’ve been hiding what’s going on from ourselves: A high-carbon future is being locked in by the world’s capital investments,” said co-author Robert Socolow. Any plan or strategy to cut CO2 emissions has to give far greater prominence to those investments. Right now the data shows “we’re embracing fossil fuels more than ever,” Socolow told me.

So what can we do to begin to prepare for a jam-packed carbon budget? First, we need to stop building fossil fuel-reliant power plants.

Surprisingly, it appears the Australia is a pioneer here, despite recently rolling back its pioneering carbon tax. Thanks to wide-spread adoption of solar energy on homes and business the country’s electricity use is in steep decline. For the first time in its history, no new coal or gas power capacity will be needed to maintain supply over the next 10 years, according to the Australian Energy Market Operator. Germany too is rapidly adopting clean energy sources like wind and solar, so as to avoid building coal or nuclear power.

Next, we need to think about meeting energy demand by improving efficiency, instead of building more power generation.

Potential energy efficiency gains of 50 percent are possible across many sectors in most countries, Socolow said, and could reduce the number of fossil fuel energy power plants.

The US is the king of energy waste by most estimates. This costs Americans an estimated $130 billion a year, according to the Alliance to Save Energy. But despite the potential for huge cost and emission reductions, governments everywhere put nearly all their energy research efforts into new sources of energy like new power plants rather than helping to develop energy-efficient cars, buildingsm and appliances. It’s 2012 international study also found that improving energy efficiency provides by far the best bang-for-the-buck for energy security, improved air quality, reduced environmental and social impacts and carbon emission reductions.

However, efficiency improvements take time, and there is precious little time left to make the CO2 emissions cuts to stay below 2˚C, said Socolow.

While refusing to say a planet that’s 2˚C hotter is inevitable, he did say that all efforts to reduce emissions must be undertaken as soon as possible: “3˚C is a whole lot better than 5˚C, the current path we’re on.”